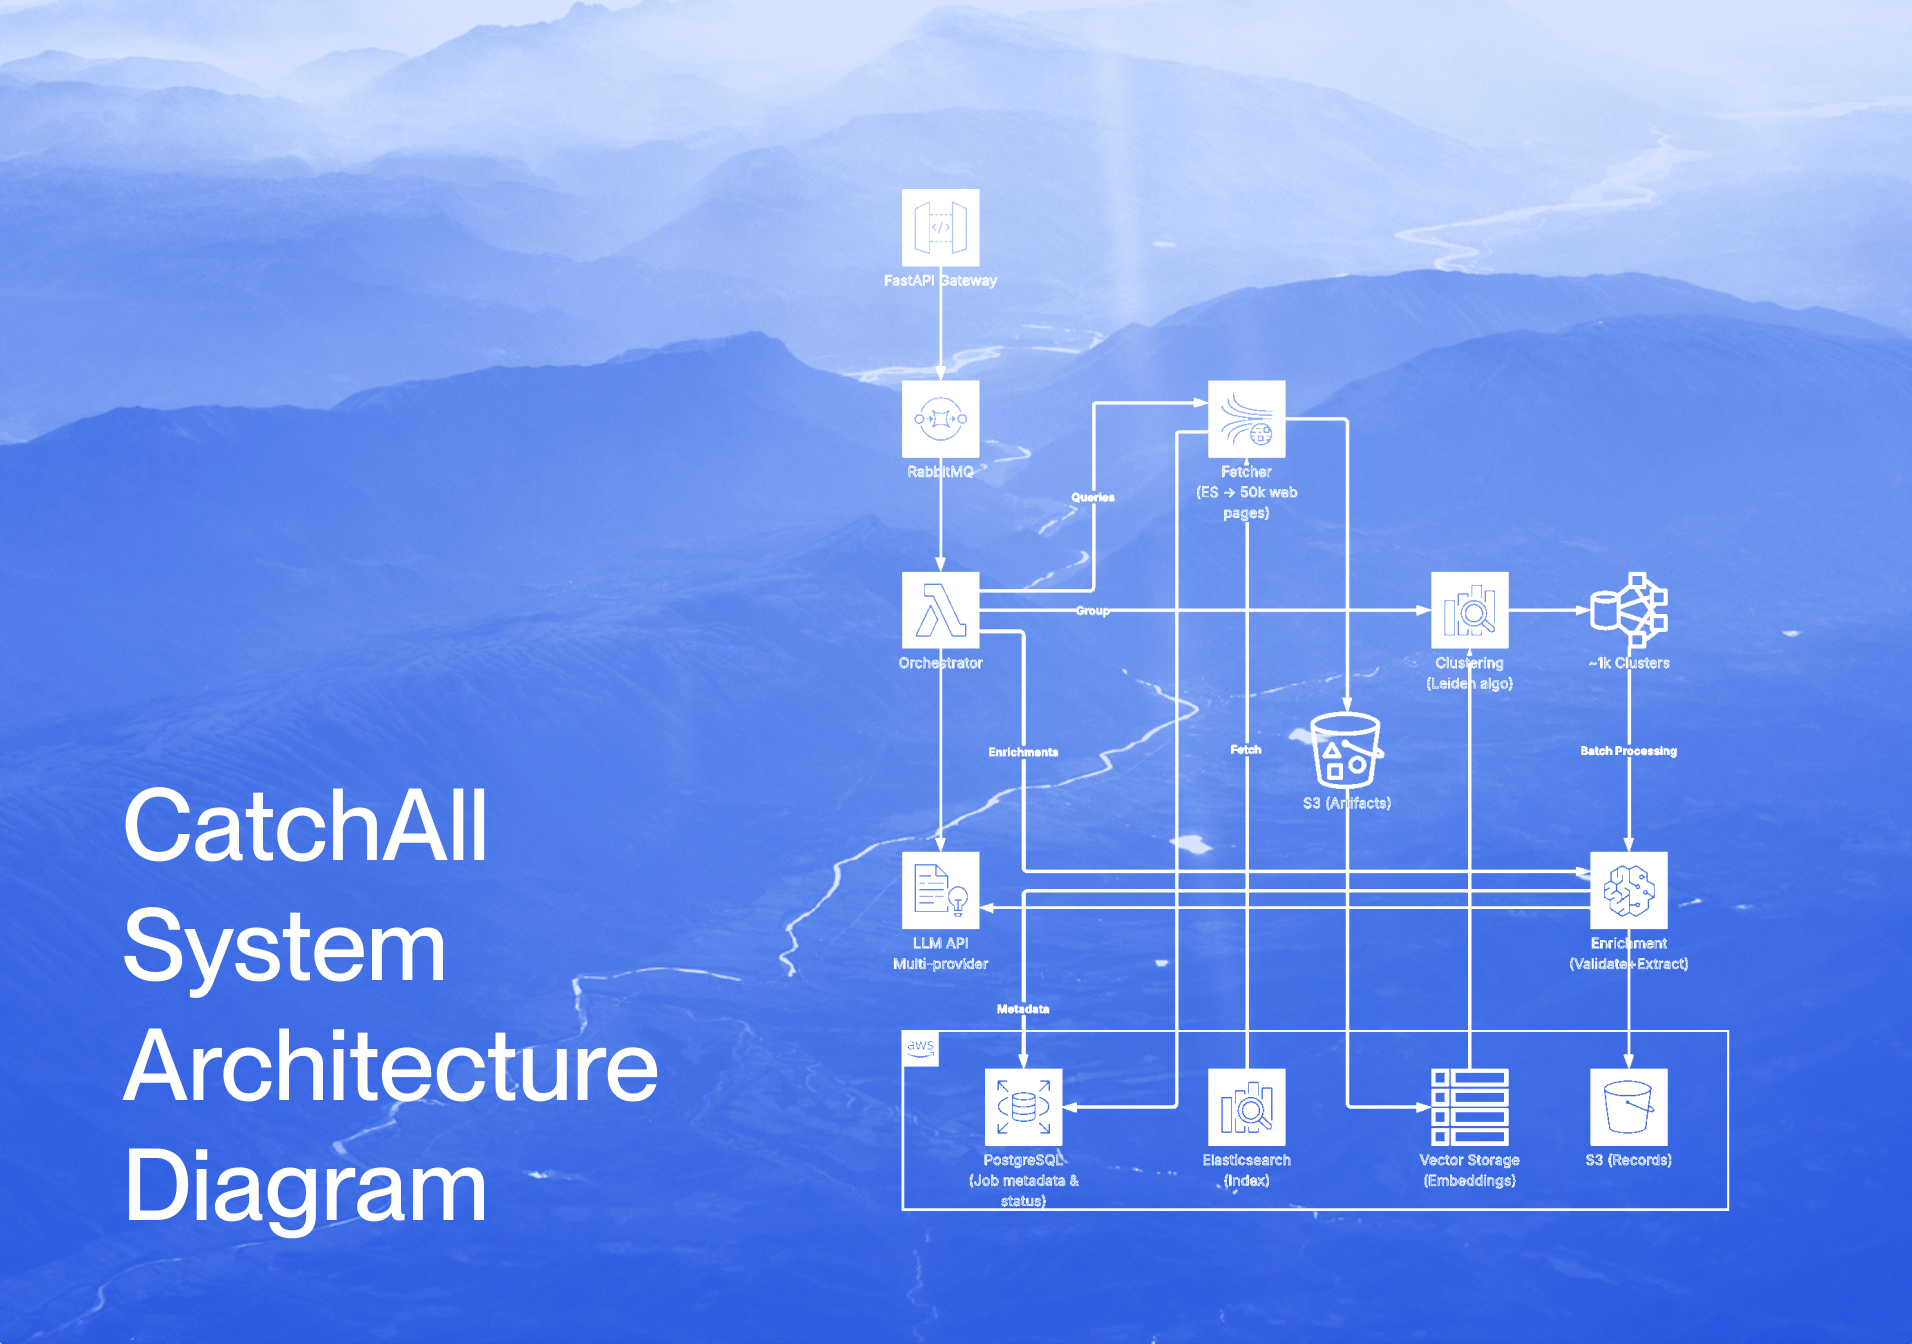








News API benchmark 2026: six providers, two tests
We ran one benchmark with two tests: can an API find the events you ask for, and how good is the data it returns? NewsCatcher leads the first, Perigon ties it, and we lose two of the data-quality measures — including the author field.
NewsCatcher engineering · October 15, 2026 · 14 min read
Comparing news APIs fairly is harder than it looks, so we did not run a single test. We ran one benchmark built on two methods, each answering a different question.
The Data Quality test takes a list of the 100 top news sources in the world and pulls 24 hours of articles for each from every provider. We check whether each source is there, and whether the date, title, author and image match the publisher’s own page. A separate one-hour run measures how quickly a new article appears. The Coverage test goes the other way. We wrote a set of difficult event-finding queries — every hospital cyberattack in a five-week window, every US IPO — and gave an AI agent each provider’s documentation alongside ours. It runs the queries, and we check how many real events each provider’s index could surface.
Neither test is perfectly like for like, and we say so up front. We cannot see inside competitors’ systems — most do not expose when they indexed an article, so latency has to be measured from the outside. And not every product is the same kind of product: Exa returns answers rather than article-level detail. We include it anyway, because it shows why having the complete, structured record matters. The section Why this is hard to compare lists every difficulty we ran into. This post gives the results of both tests, including the measures we lose.
TL;DR
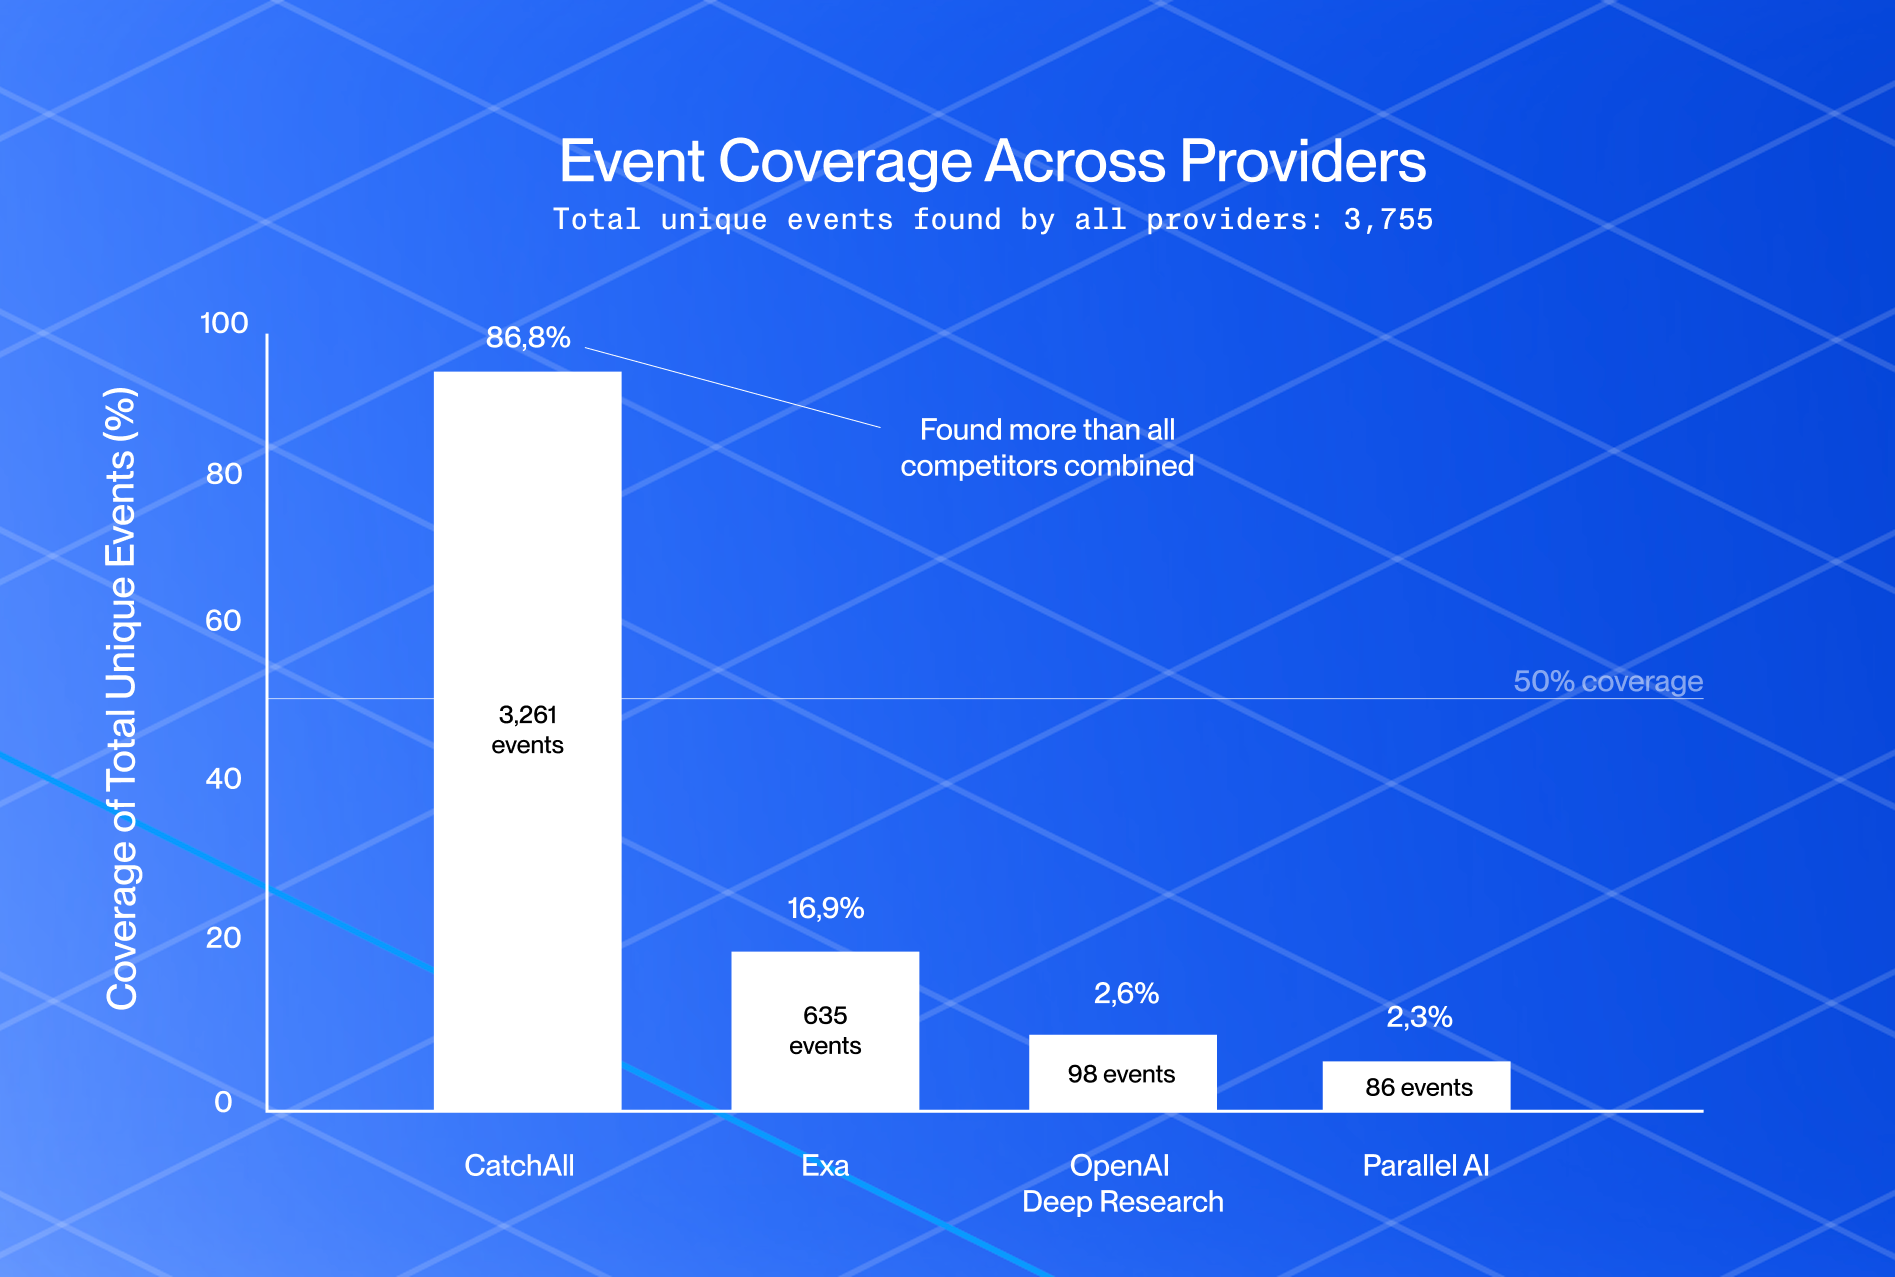
- ⭐ Coverage test: NewsCatcher leads at F1 0.644 (precision 0.928, recall 0.521) across 15 difficult event-finding tasks run by the same agent on every provider. Perigon ties it at 0.624 — the confidence interval includes zero, so we are not claiming that win.
- ⭐ On the five tasks with fewer than 50 known events, NewsCatcher found 57 of 98 — more than any other provider. On these the 50-row answer limit cannot distort the result. Perigon 47, Firecrawl 44, Newsdata 42, World News 16.
- ⭐ Data Quality test: 97 of our 100 top sources return articles, and we returned 39,241 articles in 24 hours— more than twice that of any other provider. We built the list, so read this as a check on what customers actually ask for, not an independent measure of the web.
- ❌ We lose field accuracy to Perigon, 0.789 to 0.865, almost entirely on the author field. Section below.
- ❌ NewsAPI.ai indexes new articles about five minutes faster than we do at the median, though its slowest tenth is far slower than ours.
- 🤝 Publish-date accuracy is a tie: Perigon 96%, NewsCatcher 95%, both with 3.5% of articles badly wrong.
Which provider, for what
Why this is hard to compare
These are the difficulties we met while building the benchmark. Each one shaped a decision below.
- We cannot see inside competitors’ systems. NewsCatcher returns a
parsed_datetelling us when an article was processed. No other provider exposes anything like it, so latency cannot be read from an API response. We poll every provider from outside and use our own clock instead — an approximation, from a short window, on one machine. - The products are not all the same kind of product. Exa comes in two forms here: Exa Agent returns answers without article-level detail, and Exa Search is a semantic engine rather than a news feed. Firecrawl searches Google News and scrapes the results. Many measures simply do not apply to them. We include Exa anyway, as a reminder of what you give up without a complete structured record.
- Our keys are on specific plans. Results describe those keys, not each vendor’s best tier. Where a feature failed, we checked whether it was plan-gated. Perigon’s
companyNamefilter returned not supported by your plan, and NewsData’sregionfilter asked us to upgrade. Perigon’s city and region filters are documented but were not available on our key either. NewsData’s 100-character query limit rejected 18 of our 45 client queries before any search ran. Those are plan limits, not coverage results. - Providers accept different inputs. NewsData takes at most five languages per call. Perigon always searches the article body, even on a headline-only query. For the direct query checks we therefore sent only the three fields every provider understands.
- The line-ups differ between the two tests. Each test covers six providers, but not the same six: Firecrawl and World News API are only in the Coverage test, and NewsAPI.ai and Exa Search only in the Data Quality test. NewsAPI.ai (Event Registry’s news API) ran in the Data Quality test, but its account had been disabled by the time of the Coverage test and our stability check. Webz.io could not be run at all: its account has a zero credit balance.
- There is no list of every event that happened. Coverage recall is pooled: the denominator is every distinct valid event any provider found, so all are scored against the same 892 events, including events found only by the provider we cannot name. Real recall is lower for everyone.
- Publishers’ own pages are imperfect ground truth. Publishers re-date stories after publication — 34.7% of the 18,875 pages we fetched — and 5.2% state no publish time at all. Five publishers, including the New York Times, block scraping, so they are missing from both accuracy measures. Ground truth is the publisher’s page, never another provider’s record and never a model: we tested LLM extraction, and it invented a publish time.
- Prices are not comparable at face value. NewsCatcher’s is not public, the others sell different units, and the cheapest rates need large or annual commitments. See Other things worth knowing.
Results
Six providers ran in each test. One vendor’s terms do not permit publishing benchmark results about its service, so its figures appear in no table here. It remains inside the pooled event denominator, the shared-article truth set and the 1,078-article field-accuracy intersection, because removing it would change everyone else’s numbers.
Coverage test: The Leaderboard
A sixth provider ran in this test; its figures cannot be published. Recall is pooled across all six, so the denominator includes events only it found.
Data $ per task is priced at each vendor’s cheapest public rate. The grey row is Exa Agent, Exa’s agent product: scored in the same pool, but outside the controlled comparison, because it works as its own agent rather than as a search tool under ours.
Is the gap real?
Paired bootstrap over tasks, 10,000 resamples. A difference counts only when the 95% interval excludes zero.
Perigon ties us and we are saying so. Reprint removal holds its precision at 0.897, and it beat us on tech layoffs (0.74 to 0.51) and data breaches (0.60 to 0.41). Overall it lost 8 of the 15 tasks.
The five tasks where the answer limit cannot hide anything
Each answer is capped at 50 rows. On the big tasks — US recalls has 215 known events, European strikes 220 — every provider hits that cap, so recall mostly reflects which 50 rows the agent kept. On these five tasks the total number of known events is under 50, so every one fits in an answer. Events found is then a cleaner read of how much of the story each index actually holds.
Hospital cyberattacks is the task that separates the field. NewsCatcher found 20 of 42 events; World News found one. Its precision is fine, 0.970, but it simply returns too few relevant articles to work with.
Data Quality Test
Volume. NewsCatcher returned the most articles in every part of the Data Quality test: 39,241 in the 24-hour run, more than twice NewsAPI.ai’s 18,473; 2,149 measured in the latency run, against Perigon’s 1,057; and 14,422 in the date check. Volume alone does not prove quality, which is why the other measures exist. But it does mean our scores rest on the largest sample in the test.
Sources. We miss three of the 100: huffingtonpost.com, pewresearch.org and thetimes.co.uk. Nobody returned anything for the first two, which usually means the hostname on our list is wrong rather than that every provider missed them.
Operators. The ninth, NEAR proximity, is ours alone. Both phrases always appeared, but in the text we returned they sat a median of 306 words apart, so we could not confirm the distance limit binds. We are checking it on our side.
A note on Exa. The Data Quality test uses Exa Search, a semantic search engine rather than a news feed, so several measures below are probably not comparable for it. It documents no search operators, ignores NOT completely (all 25 results for Tesla NOT "Elon Musk" mentioned Musk) and has no headline-only parameter. Where it is clearly weak we show it in grey, and we do not rank it. It is not all bad: Exa Search returned articles from 95 of the 100 sources, and Exa Agent scored F1 0.605 in the Coverage test.
Latency: how fast does a new article appear?
Latency is the moment we first saw an article minus the publish time the provider reported, from the one-hour run. Each source gets one median first, and the figures below describe the spread across sources, so one source is one vote. Pooling articles instead would let a single busy source decide a provider’s number: 39% of our own sample is 163.com alone.
NewsAPI.ai is faster at the median, by about five minutes. But the slowest tenth of its sources is far slower than ours (p90 259.5 against 70.5 minutes), so the median flatters it. We have a defect of our own here too: 105 of our articles were excluded because we saw them before their claimed publish time, a timestamp problem none of the other providers had. Our slowest sources are a short list, including businessinsider.com, reuters.com, sina.com.cn and ifeng.com.
Latency is measured from each provider’s own publish time, not the publisher’s. What keeps that honest: the five main providers are within five minutes of the publisher on 90–96% of articles, and a median is not moved far by a small tail. This is one window of roughly an hour from one machine, so treat it as indicative.
Publish-date accuracy
This is the separate check behind the latency figures: every provider’s reported publish date, compared with the date on the publisher’s own page (see The ground truth). Each provider is checked on its own articles, so the providers are not sitting the same exam. Articles are dropped where the publisher’s page has no date or a date only, or where the provider gives none. “Correct” means within five minutes.
Perigon and NewsCatcher are a tie: one point apart, with the same share badly wrong, and each checked on different articles. Publishers also re-date stories after publication — 34.7% of the articles we fetched — and a provider that recorded the original date is not at fault. NewsCatcher is correct on 93% of the re-dated articles and 97% of the rest; Perigon on 94% and 97%.
Page size and calls
Forty-five real client queries, paged until 300 new articles had been collected or the provider ran out, each using its largest page size.
This is a design difference. Our API returns up to 1,000 articles a page; the others cap at 100, NewsData at 50. So the same job takes far fewer calls, which matters for quota and rate limits. It says nothing about which results are better. It is also the number that changed most when we turned pagination on: comparing a single page from each provider, the top four looked to be within a few hundred articles of each other. That was the page cap talking, not the index. The latency run, which made about 5,000 calls per provider, shows the same pattern: we averaged 271 articles per call against 19 to 72 for the others.
NewsCatcher’s weak spot: the author field
Every provider marked on the same 1,078 articles — ones all five returned — against the publisher’s own page, with a fuzzy match. Exa Search had only 45 of them, too few to rank, so it is not in this table.
We have the best headlines in the test and the worst author field. On 25% of articles our byline is badly wrong, against Perigon’s 2%. Our median article scores 0.978, the highest here, and that one field drags the mean to 0.789. It is the entire reason we are third rather than first.
The cause is known: publishers put bylines in three different places and often several names in one string, and we were reading two of the three. Closing this to Perigon’s level would move us from third to first on this metric. It is the first thing we are fixing.
Methodology
One benchmark, two tests
Most news API comparisons count articles. That measures almost nothing — a provider can return 10,000 near-identical press releases and look excellent. We split the question in two instead.
How the Data Quality Test works
Who is in it. NewsCatcher, Perigon, NewsData.io, NewsAPI.ai, Exa Search and one provider whose terms do not allow us to publish its results. This is a different set from the Coverage test. Firecrawl Search is left out on purpose: here Firecrawl plays a different role, and its scraper only fetches the publishers’ pages for the ground truth.
The 24-hour run. For each of 100 sources, we ask every provider for the latest articles over the same 24 hours, following pagination to the end. No search words are used: an earlier version used a search phrase, and the provider that applied it least carefully scored best, because it filtered least. A returned article counts only if its link really points at that source — we do not trust the provider’s own source label.
Ground truth. Two measures, field accuracy and publish-date accuracy, are scored against the publisher’s own page, never against another provider and never by a model. Source coverage and latency do not use it. How we built it is described in The ground truth below. The 24-hour run gives three measures:
- Source coverage: does the provider return at least one real article from each of the 100 sources?
- Publish-date accuracy: is the date correct, meaning within five minutes of the time printed on the publisher’s page?
- Field accuracy: are the title, description, authors and image right? Every provider is marked on the same 1,078 articles, so nobody sits an easier exam.
The one-hour latency run. This needs a separate run, because there is no other way to measure it from outside. First, one pass per provider records everything already in the index. Then, every 60 seconds, we make one call per source and stamp any article we have not seen before with our own clock. Latency is that moment minus the article’s publish time. Articles that were already indexed when we started are excluded, since we cannot know when they arrived. Latency uses each provider’s own stated publish time, not the publisher’s, so the two are not independent: a provider that stamps an article early looks slower, and one that stamps it late looks faster. That is why publish-date accuracy is checked separately.
Direct query checks. Alongside the source-based runs we sent plain queries to each provider: nine search operators (AND, OR, NOT, phrases, brackets, two wildcards, proximity, headline-only), each result checked against the rule the query stated; the same ten queries twice, ten minutes apart, over a closed past window; and 45 real client queries, paged until 300 new articles were collected, to count the calls each provider needed.
The ground truth: publishers’ own pages
If you score NewsCatcher against Perigon, all you learn is that the two disagree. You cannot tell which one is wrong. So we went to the source: for every article we fetched the publisher’s own page and read the headline, byline, publish time and images out of its metadata. That page is the referee.
Which articles. Only articles that at least two providers returned. If we had fetched everything any one provider returned, the provider with the biggest index would be judged on thousands of articles nobody else had. Fetching only the overlap means every article in the truth set is one that more than one provider claimed to have.
Nine of the 100 sources are missing. Four were never queued, because no two providers shared an article from them: Daily Mail, HuffPost, Pew and The Times. Five block scraping with a 403: nytimes.com, people.com, chicagotribune.com, people.com.cn and nydailynews.com.
The 18,875 pages are a reference library. Each measure draws a different slice from it. Field accuracy uses the 1,078 articles that all five providers in this test returned — the same set for everyone. Publish-date accuracy checks each provider on its own articles. NewsCatcher appears in 81.6% of the truth set (15,407 articles), the most of any provider; NewsAPI.ai is next at 75.6%. It measures how often a provider’s articles were also held by someone else
How we fetched the pages. Firecrawl’s scraper made one call per article and returned the raw HTML, including the page’s <head>. We did not use Firecrawl’s own reading of the page, because any cleanup it performs is cleanup we cannot audit: if its extraction were wrong, every provider would be scored against the same wrong answer. Publish times, bylines and image links live in <meta> tags and JSON-LD, not in the article body, so we kept the title tag, every meta tag and every JSON-LD block.
How we read the facts. The rules were written before the run. For each field, the first source with a value wins, in a fixed order — for the publish time, JSON-LD datePublished first, then article:published_time and other tags — and we record which tag it came from, so every number can be traced. A few rules exist because real pages broke the simple version: we take every author tag, not just the first; a job title is stripped from a byline only after a comma, so “HT Correspondent” stays a byline; and where a publisher stamps the edit time as the publish time, we take the earlier publish-specific tag. We also flag pages re-dated after publishing — 34.7% of them — so a provider that kept the original time is not charged with the publisher’s change.
How we compare. Deterministically, with a fuzzy match: character overlap and similarity ratios, never exact string equality — a smart quote or a trailing site name should not count as a provider getting the headline wrong — and never a model. Dates must be within five minutes; images are matched on filename. The 984 pages with no publish time are excluded from date accuracy rather than counted as provider errors.
What the ground truth cannot tell you. It is biased toward publishers that allow scraping: five block it outright, including nytimes.com, so a provider unusually good or bad on those sites was not measured there. It covers only articles two providers had, so it says nothing about articles only one provider found. It is the page as it stood when we fetched it, not when it was first published. And a publisher’s metadata can be wrong: of the 9,246 pages carrying both a JSON-LD date and an article:published_time, 248 (2.7%) disagree by more than a minute, and 65 by more than an hour. We apply one rule consistently; we do not claim the publisher is always right, only that it is the same referee for everyone.
Where the 100 sources come from
Every provider is measured against the same list, built on four rules:
- Original content only. No aggregators or republishers such as yahoo.com or msn.com. Coverage of a site that mostly repeats other people’s stories says little.
- Ranked on audience, not just one signal. A mix of the Majestic Million ranking, which is link-based, and SimilarWeb, which is traffic-based.
- News and media publishers. Not blogs, company sites or social platforms.
- Worldwide. Not an English-language or US-only list; it spans countries and languages, shown below.
We wrote the list, so it is no surprise that we cover almost all of it. But it is built around what our customers care about, and every competitor is held to the same 100. Read the result as does each provider hold the sources people really ask for, not as a measure of the open web.
Link to the full list of 100 sources (Google Drive).
How the Coverage Test works
We prepared 15 difficult event-finding tasks: build a dataset of real events in a window of two to five weeks ending 8 October 2026 — tech layoffs, AI funding rounds of $50M or more, hospital cyberattacks, US recalls, big M&A deals, CEO changes, data breaches, central-bank rate decisions, European strikes, earthquakes, tech fines, AI model launches, football manager exits, US IPOs, German job cuts. Each answer is up to 50 rows, every row citing a source URL.
Who is in it. NewsCatcher, Perigon, Newsdata.io, Firecrawl Search, World News API and one provider whose terms do not allow us to publish its results, with Exa Agent scored as a reference. This is a different set from the Data Quality test: here Firecrawl competes as a search provider, and NewsAPI.ai is missing because its account was disabled.
For every provider we ran the same agent: Claude Haiku 5.5, with the same instructions, sandbox, extractor, verifier and submit step. Only the search tool and a short guide on how to query that API changed. Before the run, a research agent per provider read that provider’s documentation and made up to eight live probe calls with our key to find its limits and the query style that works best. The agent was given that guide, so it knew each API’s rules as well as ours.
Every fetch pulls up to 500 articles from every provider, so each gets the same retrieval budget. An LLM judge then opens every cited URL and checks that the row qualifies and is supported. Valid rows are merged into distinct events across all systems; near-duplicates are merged by a second judge, audited against Opus at 98.7% agreement. Precision is valid rows over total rows. Recall is pooled, as described above, and F1 is computed per task and averaged.
Other notes on method
- Response times are not reported as a result. Everything ran from one region on one machine, which cannot separate a slow API from a distant one.
- One run of each test. The Coverage test was run once and the Data Quality test was run once, so treat close results as ties. Latency comes from a single window of roughly an hour. Indicative, not definitive.
- Relevance is not scored. Judging it on what each API returns rewards whoever sends more content, not whoever is more relevant. We would rather leave it out than publish a number we do not trust.
What this means if you run a news monitor every day
If you are building event detection, the two leaders are genuinely close. NewsCatcher and Perigon tie on F1. We find more events where the answer cap does not bind — 57 of 98 against 47 — and Perigon beat us on tech layoffs and data breaches.
If you are pulling at volume, page size decides how many calls the job takes. We return up to 1,000 articles a page against 100 for most others, so 41,821 articles took 50 calls, whereas 16,167 took 167. That is quota, rate-limit headroom and wall-clock time. It does not mean our results are better.
If you need accurate bylines today, we are not the best choice. Perigon is. We expect that to change, and we will publish the re-run either way.
Other things worth knowing
- Prices are not comparable at face value. On the plans our keys are on, one benchmark task costs $3.17 at Newsdata and $0.98 at Perigon. At each vendor’s cheapest advertised rate — which usually needs a large annual commitment — the same task is $0.26 and $0.39. Perigon’s Basic and Plus plans are sold only to eligible startups; other businesses start at Commercial, from $24,000 a year with no public per-request rate. NewsCatcher’s price is not public, so it does not appear in these comparisons.
- Retrieval depth moves our own number. Under our original harness, pulling 1,000–2,000 articles a query instead of 500, NewsCatcher scores 0.652 and recovers most of the gap on tech layoffs and data breaches. The 500 cap was set so every provider got the same budget.
- Two providers are missing from parts of the benchmark. Webz.io could not be run at all (zero credit balance), and NewsAPI.ai appears only in the Data Quality test because its account was disabled before the Coverage test.
- Everyone we could test was stable. The same query over a closed past window returns the same articles ten minutes later, for all five providers we ran it on. One wobble in our own results was our test’s fault — we ran with deduplication off, and a syndication network put 35 copies of one press release on page one at an identical timestamp. With deduplication on, as every real query has it, agreement is 100%.
What’s next
- The author field fixed and re-measured. It is the clearest thing we lose.
- Relevance scored against crawled articles, so payload size stops deciding it.
- A second region, so response times mean something.
- Webz.io and Event Registry included, once the accounts are live.
- A full day of polling for latency instead of one window.
We will publish the next round whether the numbers go up or down. Several figures in this post changed because an earlier version of the test was wrong — the corrections are in the methodology, not quietly dropped.
Raw data, query sets, the list of 100 sources and scoring scripts are available on request.